|
|
|
 China Wine Market Research Report 2006
|
China Wine Market Research Report 2006

Table of contents
China wine industry started a new growth phase since 2001.
From 2001 to 2005 the annual compound growth rate of the
output, revenue and profit of wine market in China was
16.6%,19.2% and 23.7% respectively.
In 2005 the output of wine in China was 434.4 thousand tons,
increasing by 18.3% compared with the corresponding period
of the previous year; revenue exceeded 10 billion RMB for
the first time, amounting to 10.23 billion RMB, increasing
by 37.6% compared with the corresponding period the previous
year; profit was 1.256 billion RMB, increasing by 48.7%
compared with the corresponding period the previous year.
The data in 2005 suggests a sign of acceleration in growth
of China wine industry.
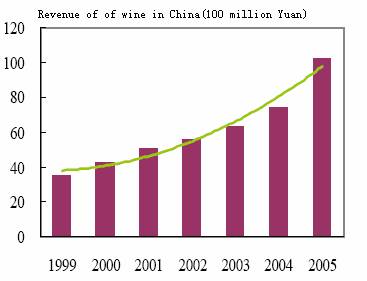
Figure 1
Revenue of of wine
in China
by year
the report provide analysis of the status and development of china wine
market, production of china wine industry ,competition of china
wine market,leading wine manufacturers in china including great
wall,changyu,dynasty, local wine market of 14 cities in china.
Table of contents
Table of contents In China 4
1.1.1 Rapid Development Of China Wine Market 4
1.1.2 High-Grade Wine Will Become The Mainstream 7
1.1.3 Right Now Per Capita Consumption Of Wine Falls Far Behind
Compared With That Abroad And It Has Broad Market Prospects. 8
1.1.4 The Main Consumption Area Is In Developed Coastal Area In
The East And South 9
1.1.5 China Wine Industry Has High Profitability 10
1.2 Production Of China Wine Industry 11
1.3 Competition Of China Wine Market 12
1.3.1 Market Share Of Major Wine Brands In China 12
1.3.2 Market Share Of Imported Wine 13
1.3.3 Change Of Competition Mode 14
1.4 Leading wine manufacturers in China 14
1.4.1 COFCO International, Ltd. 15
1.4.2 Dynasty Fine Wines Group Limited 15
1.4.3 Changyu Group 16
1.4.4 The comparison and contrast of the three leading
manufacturers 18
1.5 The status quo of the main sale channel for domestic wine 19
1.5.1 Wine enterprise depends on distributors 19
1.5.2 Wine franchisers make great profit. 20
1.5.3 Sale channels of the main domestic wine producing
enterprises 20
Chapter 2 China Wine Market By City 22
2.1 Shanghai wine market 22
2.2 Nanjing wine market 25
2.3 Wenzhou wine market 27
2.4 Ningbo wine market 30
2.5 Xiamen wine market 33
2.6 Fuzhou Wine Market 36
2.7 Quanzhou wine market 38
2.8 Guangzhou wine market 38
2.9 Shenzhen wine market 40
2.10 Zhuhai wine market 41
2.11 Dongguan wine market 42
2.12 Shantou wine market 44
2.13 Haikou wine market 45
2.14 Liuzhou wine market 46
Tables
Table 1 Output of wine in China, 1991-2005 10
Table 2 Output of wine and growth rate by province in 2005:
tons, % 11
Table 3 Leading wine manufacturers in China and their brands 13
Table 4 The product position of the three leading manufacturers
17
Table 5 the gap between the factory price and market price of
high class wine 19
Table 6 Sale channels of the main domestic wine producing
enterprises 19
Table 7 Wine brand competition in Shanghai 21
Table 8 Analysis of marketing channel of wine in Shanghai 22
Table 9 Wine brand competition in Nanjing 24
Table 10 Analysis of marketing channel of wine in Nanjing 25
Table 11 Wine brand competition in Wenzhou 27
Table 12 Analysis of marketing channel of wine in Wenzhou 27
Table 13 Wine brand competition in Ningbo 29
Table 14 Analysis of marketing channel of wine in Ningbo 30
Table 15 Wine brand competition in Xiamen 33
Table 16 Wine brand competition in Fuzhou 35
Table 17 Wine brand competition in Guangzhou 37
Table 18 Analysis of marketing channel of wine in Guangzhou 38
Table 19 Wine brand competition in Shenzhen 39
Table 20 Analysis of marketing channel of wine in Shenzhen 40
Table 21 Wine brands competition in Zhuhai 40
Table 22 Analysis of marketing channels in Zhuhai market 41
Table 23 Wine brands competition in Dongguan 41
Table 24 Analysis of marketing channels in Dongguan market 42
Table 25 Wine brands competition in Shantou 43
Table 26 Wine brands competition in Haikou 44
Table 27 Wine brands competition in Liuzhou 45
Table 28 Wine brands competition in Liuzhou 45
Figures
Figure 1 Output of wine in China by year 3
Figure 2 Revenue of of wine in China by year 4
Figure 3 Age structure of Chinese population in 2004 5
Figure 4 Effect of substitution of consumption of wine 6
Figure 5 Per capita consumption of wine by country(L/cap) 8
Figure 6 Comparison of profitability of main alcoholic drinks in
China 9
Figure 7 Market distribution of major wine brands in China 12
Figure 8 The trend of the wine sales quantity of COFCO
International, Ltd 14
Figure 9 The capacity utilization and sale of Dynasty Fine Wines
Group Limited 15
Figure 10 The sale revenue composition of Changyu Group 16
Figure 11 The average sale price and gross margins change of
Changyu wine 16
Figure 12 Sale composition of Changyu wine 17
Figure 13 The sale of all types of Changyu wine 17
Figure 14 The contrast of the average price of the wine from the
three leading wine manufacturers 18
|
| |
 |
| Contact us
Add:Room A803,A805, Golden Prosperity Center,TangJiaCun,Guangqu East Road, Chaoyang District, Beijing, 100022 P.R.China
Tel:+86-10-67716608 +86-10-67716526/28 Mr. Shen, Ms Zheng
Fax:+86-10-67716520 Email: shenwei@hlsf.net
See Payment Routing inforation
|
| |
|